

Study site location and overview
This use case is located in the northwest margin of the Tagus estuary (Figure 1), located in Lisbon, central west coast of Portugal, and is surrounded by the large metropolitan area of Lisbon, with a population of approximately 3 million, the largest urban center at the Atlantic Coast of Europe (Pinto and Kondolf, 2016). Due to its social and economic context and its environmental characteristics, it is considered the most important estuary in Portugal and it is one of the largest found in Europe (Freire et al., 2016). Along the selected coastal stretch 3 sub-areas will be explored in the EOatSEE project : 1) Bafureira beach, pocket beach backed by a sedimentary rocky cliff; 2) Carcavelos beach, an sandy dissipative pocket beach, backed by seawall and several infrastructures (e.g., restaurants, shops, road); and 3) Commerce Square, low-lying shore close to an important urban area with a seawall (Figure 1).
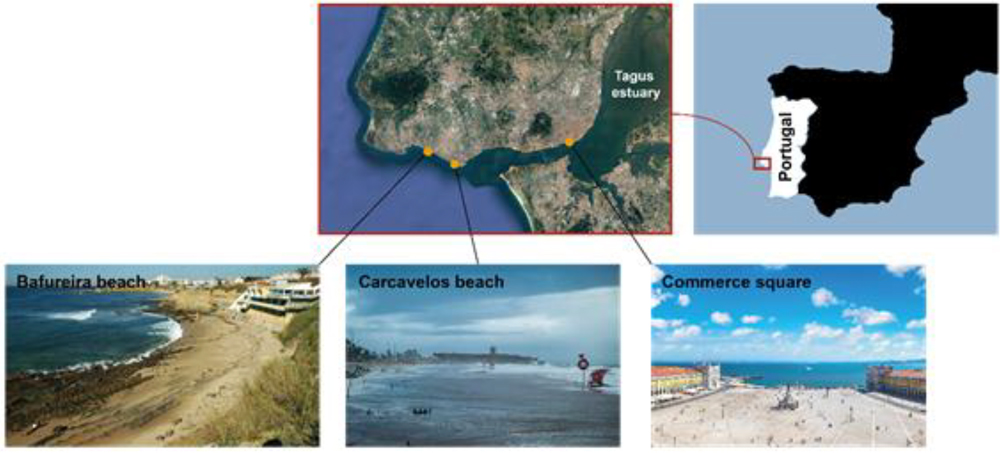
Figure 1 – Use case Tagus estuary location and sub-areas selected for the EOatSEE project.
Key hydrodynamics, extreme sea level events and related coastal hazards
The Tagus estuary is exposed to a mesotidal regime (maximum tidal amplitude of 4.1 m (de Pablo et al., 2019)), and the astronomical tides play a key role in causing extreme sea level events due to resonance effects (Fortunato et at., 1999, Guerreiro et al., 2015, Rilo et al., 2015). During winter and extreme precipitation events, the river flow increases leading to compound flooding events when combined with high tide during spring tide. The most impacted regions from this type of compound flooding are the low-lying central region of Lisbon (such as the Commerce square – Figure 1). The western region of the study area is more exposed to waves and therefore the main drivers of coastal hazards (erosion and flooding) are due to the combined effects of tides, waves and storm surges. The shoreline orientation (approximately W-E orientation) and the shelter offered by the Raso cape protects this coastal region from the most energetic swell waves coming from NW,. (Jaranovic et al., 2017). Nevertheless extreme storm events such as “Hercules” (between 6 and 7 January 2014), even approaching from NW direction caused severe erosion and flooding in several locations, including Bafureira and Carcavelos beaches (Santos et al., 2014). However, the passage of subtropical depressions generating wave regimes from the SW is frequent. This type of system, more sporadic and short-lived, can be quite intense and with greater impact (severe erosion and flooding) along the coastlines between Lisbon and Cascais coast. The nearshore bathymetry is a key factor for wave propagation and energy dissipation in this region, with the Cascais and Lisbon canyons having an important influence on the wave propagation into the coast (Jaranovic et al., 2017).
Existing datasets and models
As a result of a collaboration with the municipality of Cascais (early user adopter of EOatSEE), +ATLANTIC have previously developed and applied a high-resolution downscaling model approach (Figure 2) to simulate nearshore hydrodynamics, sediment transport, dispersion of contaminants, and coastal overtopping along the Cascais coast (project called Cascais.SEA). These models will be used in EOatSEE to further investigate, develop and validate the implementation of EO-products in extreme sea level events and resultant hazards in this coastal region. Nearshore hydrodynamics such as currents, water level, and water properties (temperature, salinity) will be simulated by the physics-based model MOHID. It is an open-source model whose code can be accessed at https://github.com/Mohid-Water-Modelling-System/Mohid. Tagus river flow data will be provided by Emodnet river, and together with hydrodynamic models will be useful to simulate compound flooding (combined extreme fluvial discharge and extreme storm surges) events in the estuary. The numerical model SWAN (Simulating WAves Nearshore) will be executed simultaneously to simulate wave conditions in the study sites. Subsequently, a coupling between MOHID and SWAN (already made) will simulate sediment transport along Lisbon-Cascais coast and finally the model XBeach will be additionally implemented to compute nearshore inundation and erosion.

Figure 2 – Input datasets and physics-based models used in case study #1 Tagus estuary.
The model grid has been setup using EMODnet bathymetry (emodnet-bathymetry.eu) and the nearshore topography using LiDAR survey performed in 2017 by the municipal of Cascais. PCOMS (Portuguese Coast Operational Modelling System) will be used to access the input data from currents and water properties to implement MOHID model in the study site. Astronomical tides are obtained from the model FES2014 outputs, wind and waves are given by MM5 and WaveWatchIII models, respectively. Both outputs from the operational models from Maretec (Instituto Superior Tecnico) (Forecast MARETEC).
In EOatSEE, +ATLANTIC will validate model results with the following datasets: the in-situ datasets include the Cascais tide gauge (the tidal gauge with longest temporal record in Portugal) for local sea level trend, for astronomical tides and storm surge; the coastal sea state will be obtained from the Lisbon Port wave buoy; for river discharge a local river-station will give Tagus river flow data (https://snirh.apambiente.pt; TagusAlmourol (emodnet-physics.eu)); and finally the EO-datasets identified in Task 2 will be integrated in the model chain and(or) used for validation proposes.
References:
de Pablo, H., Sobrinho, J., Garcia, M., Campuzano, F., Juliano, M., & Neves, R. (2019). Validation of the 3D-MOHID hydrodynamic model for the Tagus coastal area. Water, 11(8), 1713.
Freire et al., (2016). A local-scale approach to estuarine flood risk management. Natural Hazards. 84:1705–1739
Pinto, P.J.; Kondolf, G.M (2016). Evolution of Two Urbanized Estuaries: Environmental Change, Legal Framework, and Implications for Sea-Level Rise Vulnerability. Water 2016, 8, 535.
Fortunato, A. B., Oliveira, A. & Baptista, A.M. (1999). On the Effect of Tidal Flats on the Hydrodynamics of the Tagus Estuary. Oceanologica Acta, 22 (1): 31–44.
Guerreiro, M., Fortunato, A.B., Freire, P., Rilo, A., Taborda, R., Freitas, M.C., Andrade, C., Silva, T., Rodrigues, M., Bertin, X., Azevedo, A. (2015). Evolution of the Hydrodynamics of the Tagus Estuary (Portugal) in the 21st century, Revista Gestão Costeira Integrada / Journal of Integrated Coastal Zone Management, 15(1): 65–80.
Jaranovic, B., Trindade, J., Ribeiro, J., & Silva, A. Using A Coastal Storm Hazard Index to Assess Storm Impacts in Lisbon Using A Coastal Storm Hazard Index to Assess Storm Impacts in Lisbon.
Rilo, A., Freire, P., Santos, P. P., Tavares, A. O., & Sá, L. (2015). Historical flood events in the Tagus estuary: contribution to risk assessment and management tools. Safety and reliability of complex engineered systems, natural hazards. CRC Press, Taylor and Francis Group, London, 4281-4286.
Santos, A., Mendes, S., Corte-Real, J., (2014). Impacts of the storm Hercules in Portugal. Finisterra, XLiX, 98, 2014, pp. 197-220
Study site location and overview
The Azores is an archipelago composed of nine volcanic islands in the North Atlantic Ocean, about 1600 Km west of Lisbon, as reported in Figure 3. This group of islands have vulcanic origin, and their formation is related to the triple joint of the three tectonic plates: North American, Euro-Asiatic and African. In these volcanic islands the coastal geomorphology is characterised by rocky shores, gravel beaches or coarse sandy beaches, all with a reflective nature (very steep slopes).
Key hydrodynamics, extreme sea level events and related coastal hazards
These islands have been recently subject to extreme events, such as extreme storm surges due to the passage of hurricanes, such as the example of Hurricane Lorenzo (Figure 3), in September 2019, that impacted the Corvo and Flores islands, with winds peaking at 260 km/h. Lorenzo then weakened to a Category 2 with winds of 165 km/h and hurtled toward the Azores on 2 October in the early morning.

Figure 3 – Location of Azores islands and the impact of Lorenzo hurricano on the coast.
Existing datasets and models
The model SURF-U (developed by CMCC) unstructured grid covers the mid-Atlantic region approximately delimited by the geographical coordinates [−33W, −29W] [37W, 41N] and including the Corvo and Flores islands of the Azores archipelago. The horizontal resolution ranges from 3 km in the open sea to 500 m in the coastal waters of each island. The bathymetry was derived from the GEBCO product at a resolution of 30 arc-seconds (about 830 × 830 meters). The vertical z-layers are selected to be 2 m from the surface up to a maximum of 200 m from 1000 m from the bottom. The initial and lateral boundary conditions are obtained from the Global component of the CMEMS analysis products (GLOBAL_ANALYSIS_FORECAST_PHY_001_024). As no in situ oceanographic data is available for the area and period of interest, the validation of the model results in terms of sea level and waves will rely on multi-mission satellite altimetry and SAR EO-products collected or developed in tasks 2 and 3 of EOatSEE. Statistical comparisons between the model outputs and the EO parameters will be performed from the open ocean to the closest measurements near the shore.
Study site location and overview
The Dutch coast (Figure 4) is an example of a delta for which several in situ datasets are freely and openly available. Deltas are by nature prone to compound flooding. With 12 million people (over 70% of the population) in the Netherlands living in the low elevation coastal zone, current and future protection against the sea is high on the political agenda (National Delta Programme). It is expected that the Netherlands is protected for up to 1 m of SLR. However, if sea level rises more than this, serious issues will arise related to compound flooding, salinity intrusion, and possibly overtopping of coastal structures, beach and dune erosion will exacerbate.

Figure 4 – Map of the Dutch coast. Legend (top to bottom): beach, dunes and hinterland (source: https://www.collegevanrijksadviseurs.nl/adviezen-publicaties/publicatie/2018/05/15/advies-kwaliteit-van-de-kust)
Key hydrodynamics, extreme sea level events and related coastal hazards
Floods occur when the water cannot be sufficiently absorbed or discharged, for example when local downpours, and high water in the rivers are accompanied by high water at the coast. Such conditions can occur in the Netherlands during storms and in other parts of the world during hurricanes. Salt intrusion in rivers and salinization of (ground) water bodies can be another example of close intertwining of water and coastal management. In the Netherlands, coastal erosion has been counteracted through beach nourishments since the early 1990s.
In EOatSEE, specific attention will be given to a sandy coastal stretch backed by a dune coast and beach-dune erosion for different storm surge conditions (Figure 5). The wind climate is influenced by mid-latitude westerlies and depressions following the Gulf Stream in the direction of Norway. Associated gradients in air pressure and fronts cause temporary southerly and easterly winds followed by the prevailing southwesterlies, and storm surge conditions, with strong (northwesterly) winds and high seas occurring regularly in winter.

Figure 5 – Example of a single row of dunes protecting densely populated and economically important areas (with an average elevation below mean sea level) in the Netherlands.
Coastal dunes occur worldwide along sandy shores. A supervised classification of a cloud-free global composite of Sentinel-2 images from 2016 found that 31% of the world’s ice-free shorelines are sandy, or gravelly. Analysis of a complementary Landsat-derived shoreline data of a 33-year period (1984–2016) indicates that 24% of these sandy beaches are eroding at rates exceeding 0.5 m/yr, while 28% are accreting, and 48% are stable (Luijendijk et al., 2018). Coastal dunes exist where areas of persistent coastal sand supply and dominant onshore winds favour episodes of inland transport to create broad dune fields (Martínez and Psuty, 2004).
Existing datasets and models
Assessment of the combined effect of sea level rise and extreme storms on dunes is needed to enhance climate resilience of dunes using natural processes. To support an Interreg project ENDURE https://www.interreg2seas.eu/en/endure, Deltares combined generic morphodynamic concepts (behaviour models) with wave and storm surge statistics (reanalysis data) to illustrate possible future scenarios for several transects along dune coasts.
For the Dutch coast, Deltares has access to all-in situ dataset mentioned in the SoW p.29, and Deltares has high resolution downscaling models in place (e.g. https://www.deltares.nl/en/projects/3d-dutch-continental-shelf-model-flexible-mesh-2/). Hence, The Dutch case, with many long-term datasets (from e.g. weather stations, wave buoys and gauges, and yearly coastal profiles) is an ideal case for benchmarking EO and models. We will assess if/how we can export to other sandy coasts, and which technologies to use where.
References:
Luijendijk, A.,Hagenaars, G., Ranasinghe, R., Baart, F., Donchyts, G., Aarninkhof, S., 2018. The State of the World’s Beaches. Scientific Reports 8:6641 doi:10.1038/s41598-018-24630-6
Martínez, M. L. & Psuty, N. P. (eds). Coastal Dunes: Ecology and Conservation 171 (Springer-Verlag, Heidelberg, 2004).
Study site location and overview
Italian Adriatic Sea coastal areas are characterised by a low lying coastal profile, highly populated which is heavily impacted by extreme storm surge events and chronically affected by coastal erosion in many sites (Figure 6). For this use case, two areas of the Adriatic Sea will be investigated: the Apulia region coastal area; and the Emilia Romagna region coastline, including the Po river Delta.
For the Emilia Romagna region and Po delta: The Emilia-Romagna coastline is particularly vulnerable to sea storms due to its low-lying nature and high coastal urbanization (Armaroli and Duo, 2018) with the water levels often exceeding those of the dune crest and building foundations during major storm events (Harley et al., 2016).

Figure 6 – Study area in Emilia-Romagna region with sea level forecast field (left) and picture from a real storm surge event along the Emilia-Romagna coastal area.
Key hydrodynamics, extreme sea level events and related coastal hazards
Region Emilia-Romagna (see support letters) reports several extreme events in the coastal area. The analysis was developed by integrating the data from the work ‘The Storms and the Impacts on the Coast in Emilia-Romagna, 1946-2010’, for the period 2007-2010 and the new data collected in the DB in_Storm starting from 2011 by Region Emilia-Romagna. In the 2007-2011 interval, the total number of storm surges that caused some form of impact on the coast were a total of 66, distributed mainly in the months of December, November, May, February and March (figure 7).
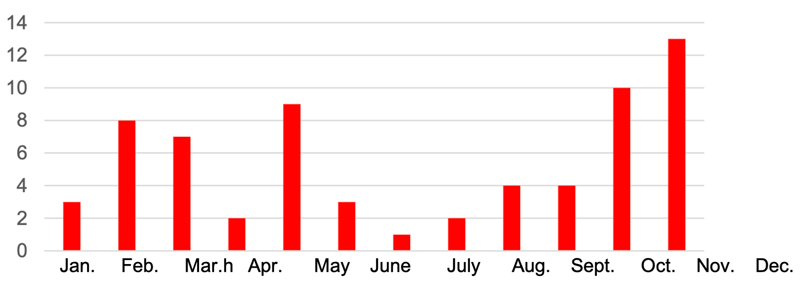
Figure 7 – Monthly distribution of storm surges in Emilia-Romagna with impact – 2007-2020 period.
For the Apulia Region, the area of interest domain reported in Figure 8.
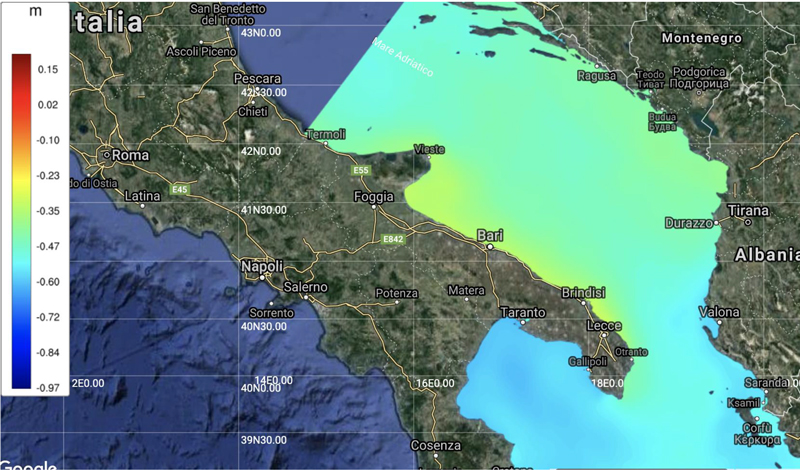
Figure 8 – SANIFS area with sea level forecast field
In the Puglia region, along many areas of the coast, the shore erosion due to winds and storm surges is clearly visible. Extreme events such as coastal storms, remove sediments from the shore, and cause erosion, inundations and degradation of ecosystems.
Existing datasets and models
The area is already covered by the CMCC forecasting system SANIFS (Southern Adriatic Northern Ionian forecasting system). SANIFS includes a sea level forecast (based on SHYFEM 3D very high resolution model) and has recently been updated with a wave modelling component. SANIFS (Federico et al., 2017) is based on the SHYFEM (System of Hydrodynamic Finite Element Modules) model (Umgiesser et al., 2004; Ferrarin et al., 2020), which is a 3D fully-baroclinic finite-element hydrodynamic model that solves the primitive equations under hydrostatic and Boussinesq approximations. The model is based on an unstructured-grid approach with a variable horizontal resolution, particularly suitable for coastal applications with a complex geometry and bathymetry, while not neglecting large-scale processes. The variable resolution ranges from 3km in open sea to 100m in overall coastal areas to 20m in specific hotspots (e.g. harbors, marine protected areas). With this ultra-fine discretization, an accurate representation of irregular coastal boundaries is achieved, including very tight straits, small islands, as well as port constructions and facilities: wharfs, marinas, narrow breakwaters, and revetments. The bathymetry data at a resolution of 1/8 arc minutes (∼ 230 m) obtained from the EMODNET Portal for the open sea and coastal waters were combined with the finer resolution bathymetry for the specific hotspots, provided by the Italian Navy Hydrographic Institute. Along the vertical axis, the model levels are uniformly distributed from the sea surface to 90 m with a layer thickness of 2 m. Atmospheric fields with a horizontal resolution of ∼12.5 km and 3-hour frequency delivered by ECMWF are used for atmospheric forcing. The Mediterranean Forecasting System (Clementi et al., 2019) at a horizontal resolution of 1/24° (∼ 4 km) and 141 unevenly spaced vertical levels provided within the framework of the Copernicus Marine Environment Monitoring Service (CMEMS) is used as a parent model for both the initialization and for setting the lateral open boundary conditions. A total of eight tidal components were imposed at the open boundaries of the parent model. Tidal data were taken from the OTPS tidal model (Egbert and Erofeeva, 2002).
The system is run operationally on a daily basis producing a three-day forecast. More details on the physics parameterizations and numerical schemes used can be found in Federico et al. (2017). The system has been validated both in hindcast (against satellite SST, argo floats and tide gauges) and forecasting mode during specific oceanographic campaigns collecting ADCP, CTD, tide gauge data. The model has been used to force downstream applications, such as search-and-rescue and oil spill models (Liubartseva et al., 2021). The model outputs are visualized in a web platform https://sanifs.cmcc.it.
In addition WW3 wave model on the same unstructured grid of SANIFS will be used to simulate waves and assess their contribution to storm surge. Several users and early adopter will collaborate (See letters of Interest) with this pilot: Arpa SIM Emilia-Romagna; Emilia-Romagna Region; ASSET Agency of Apulia Region; Civil protection of Apulia Region and Marine Protected areas of Torre Guaceto.
References:
Armaroli, C., Duo, E., 2018. Validation of the coastal storm risk assessment framework along the Emilia-Romagna coast. Coast. Eng. 134, 159–167.
Clementi, E., Aydogdu, A., Goglio, A. C., Pistoia, J., Escudier, R., Drudi, M., Grandi, A., Mariani, A., Lyubartsev, V., Lecci, R., Cretí, S., Coppini, G., Masina, S., & Pinardi, N. (2021). Mediterranean Sea Physical Analysis and Forecast (CMEMS MED-Currents, EAS6 system) (Version 1) Data set. Copernicus Monitoring Environment Marine Service (CMEMS).
Egbert, GD and SY Erofeeva (2002). “Efficient inverse modeling of barotropic ocean tides”. In: Journal of Atmospheric and Oceanic technology 19.2, pp. 183–204.
Federico I., N. Pinardi, G. Coppini, P. Oddo, R. Lecci, M. (2017). Mossa: Coastal ocean forecasting with an unstructured-grid model in the Southern Adriatic Northern Ionian Sea, Nat. Hazards Earth Syst. Sci., 17, 45-59, doi:10.5194/nhess-17-45-2017 .
Ferrarin, C., Valentini, A., Vodopivec, M., Klaric, D., Massaro, G., Bajo, M., De Pascalis, F., Fadini, A., Ghezzo, M., Menegon, S., Bressan, L., Unguendoli, S., Fettich, A., Jerman, J., Ličer, M., Fustar, L., Papa, A., and Carraro, E. (2020). Integrated sea storm management strategy: the 29 October 2018 event in the Adriatic Sea, Nat. Hazards Earth Syst. Sci., 20, 73–93, https://doi.org/10.5194/nhess-20-73-2020.
Harley, M. D., Valentini, A., Armaroli, C., Perini, L., Calabrese, L., and Ciavola, P. (2016): Can an early-warning system help minimize the impacts of coastal storms? A case study of the 2012 Halloween storm, northern Italy, Nat. Hazards Earth Syst. Sci., 16, 209–222, https://doi.org/10.5194/nhess-16-209-2016.
Liubartseva S., I. Federico, G. Coppini, R. Lecci (2021), Stochastic oil spill modeling for environmental protection at the Port of Taranto (southern Italy), Marine Pollution Bulettin.
Umgiesser, G., Canu, D. M., Cucco, A., and Solidoro, C (2004).: A finite element model for the Venice lagoon: Development, set up, calibration and validation, J. Marine Syst., 51, 123–145.
Study site location and overview
The Republic of Marshall Islands (RMI), in the northern Pacific Ocean, is one of the world’s smallest, most isolated, and vulnerable nations. RMI’s population is estimated at about 60,000, 70% of whom live in the urban areas of Majuro (Majuro atoll) and Ebeye (Kwajalein atoll). With an average land elevation averaging only 2 meters above mean sea level, RMI is affected by several natural hazards, including flooding due to typhoons, swell waves, extreme rainfall, and coastal erosion, all aggravated by the effect of sea level rise and climate change.
In July 2021, the Government of RMI and Deltares signed a Memorandum of Understanding to formalize an ongoing collaboration that started in 2016. Within this collaboration, Deltares has assisted RMI in assessing the impact of natural hazards and sea level rise and developing adaptation measures to reduce risk, among other topics. These studies have also been carried out in close cooperation with other regional organisations such as the Pacific Community (SPC), the Secretariat of the Pacific Regional Environment Programme (SPREP), and the United States Geological Survey (USGS).
Existing datasets and models
In two coastal vulnerability assessments (CVAs), for Ebeye island and Majuro atoll, (Figure 9 and 10), Deltares used physics-based numerical models (e.g. Delft3D, SWAN, XBeach, SFINCS) to map flood depth, impact, and risk from typhoons, tsunami, swell waves, and extreme precipitation, under current conditions and for future sea level scenarios. In the most recent study (completed in 2021), Deltares led a project to develop long-term (100+) strategies for climate adaptation for the entire country, which is being used to inform the RMI National Adaptation Planning process. One finding from that study was that global bathymetry and especially global topography datasets are insufficient for assessing the impact of coastal hazards in small, low-lying islands, thus making it a challenge to develop data-driven adaptation measures.

Figure 9 – Extreme wave heights around Majuro atoll, for three return periods, derived from an extreme value analysis on modelled nearshore wave time series. Source: Ongoing work for the Majuro CVA by Deltares, 2021.
In EOatSEE, the use of EO-derived bathymetry and topography, and how that can improve the flooding simulations will be of great importance for the Marshall Islands low-lying environments. Existing recently-collected LiDAR topography (1-m resolution) for Ebeye and Majuro will be available for validation. The findings would then be used to assess to what extent the EO-derived topography and bathymetry could improve impact assessments in the outer islands, where only very coarse global elevation datasets were previously available.
Study site location and overview
The area of interest is located in the Indian Ocean, towards the coasts of Madagascar. The circulation map taken from the EU Copernicus Marine Service (CMEMS) modelling global ocean shows an active dynamics in this area (Figure 11), where the Southern Equatorial Current impacting the Madagascar splits in two branches, as evidenced in Figure 11.

Figure 11 – CMEMS global ocean map of Indian Ocean (Mercator Ocean) Flood
This case study will focus on the Antsiranana bay, a natural bay that stretches close to 20 kilometres north to south along the northeast coast of Madagascar (Figure 12). The bay is exposed to the open ocean with a small opening of less than 2 km and affected by a large tidal range (order of 1.5-2.0m).
The study will investigate the influence of the northern branch of the Southern Equatorial Current on coastal areas of Antsiranana bay, where velocity is around 1.5m/s.
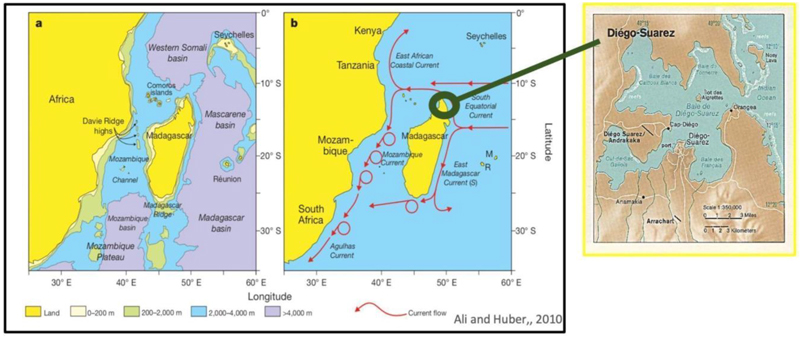
Figure 12 – Equatorial Current and focus on Antsiranana bay
Existing datasets and models
A relocatable SURF model will be used in this use case. For the model set up, the coastline used is the OPENSTREETMAP, able to provide high resolution and local information with geometrical details of coastline and islands The bathymetry is the latest version of GEBCO, with resolution of 15 arcsecond. Both datasets, OPENSTREETMAP and GEBCO are already embedded in the SURF platform when you download it. The horizontal resolution ranges from 1.5 km in open ocean to 200m at the coast. The vertical discretization is based on a layer approach with 40 levels having a thickness of 2m in surface down to 30m and then progressively (stepwise) increased toward the bottom.
The Ocean Forcing we use to initialise and laterally force our downscaled model is the CMEMS GLOBAL OCEAN model by Mercator, with resolution of about 8km providing three dimensional fields and sea level. The variables used are: 3D temperature, salinity, velocity, and sea level from Copernicus Marine (CMEMS) GLO-CMEMS (GLOBAL_ANALYSIS_FORECAST_PHY_001_024) analysis with resolution of 1/12 products (daily mean).At the boundary, the variables of CMEMS-Global model are completed by the inclusion also of the tidal signal from the astronomical tidal model OTPS, in addition to the sea surface height.
The type of boundary conditions imposed are
– Clamped for sea level and inflow temperature and salinity.
– Zero-gradient for outflow temperature and salinity.
– Nudged for total velocities.
The atmospheric forcing comes from ECMWF with resolution of one-tenth of degree. The variables used in our parametrization are 2m air temperature, 2m dew point temperature, Mean sea level atmospheric pressure, Meridional and zonal 10mwind components, Total cloud cover, Total precipitation. And the type of parameterizations are the bulk-formulae described by Pettenuzzo et al. for the heat flux; and the Hellermann and Rosenstein parametrization for the wind stress. In addition, WW3 wave model on the same unstructured grid of Shyfem will be used to simulate waves and assess their contribution to storm surge.
